Does Higher Magnitude and Frequency of Windstorms Cause Higher Damage, are there any other factors?
As the fourth largest country in the world, the United States has always been a victim of a variety of natural disasters. In 2020 alone, there were 22 natural disasters that costed a combined total of 95 billion dollars in damage, 13 of which were severe storms. Among the natural disasters, the most prominent ones have been windstorms. Severe storms have an average cost of 2.3 billion dollars and unfortunately it also happens to be the most prominent out of all natural disasters in the US.
Natural disasters are not preventable even with extensive data. We can work to infer the patterns to minimize loss using the data. Our dataset focused on the storm events in 2020, analyzing the patterns of storm events by regions and factors in severity of windstorms by windstorms. We quantify the severity of windstorms by value of damage property by storms. We will be creating models on the value of damage property in each state in respect to frequency of the storm events, average magnitude, GDP Per Capita by state, average home value, average elevation by state. We hope our work can help the country to know the pattern of windstorms and implement more effective protections, especially for those most affected areas, and thus minimizing the financial loss.Patterns of Windstorms?
1 The Map on Number of Windstorms by State
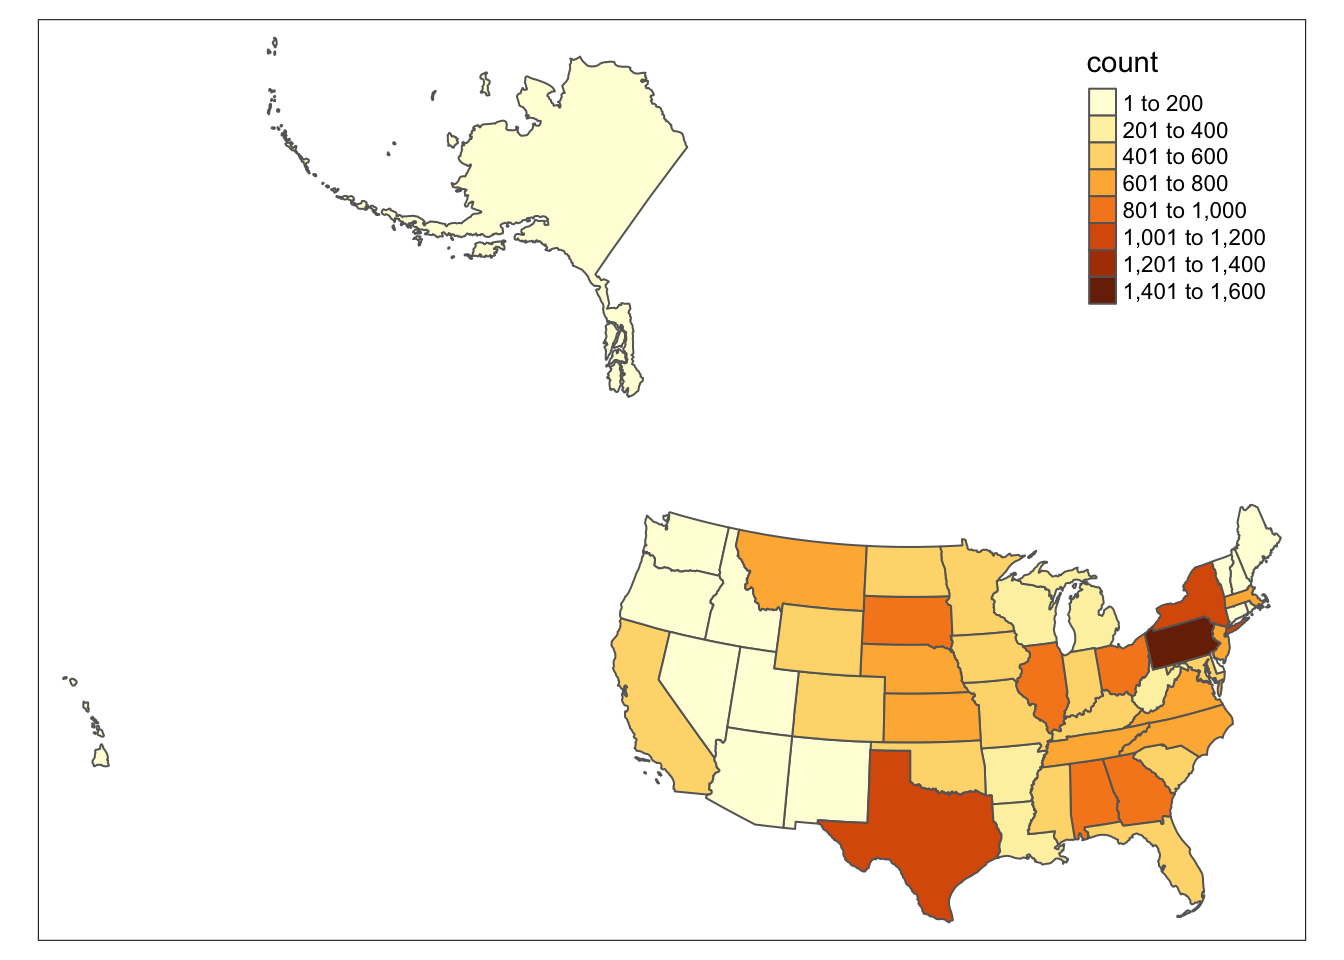 It is easy to see that the storms mostly occurred in the midwest region. The south region and east region have some states which will have significant numbers of storms in 2020. This is due to Southern and Midwestern states being heavily affected by severe windstorms due to being situated where the warm air from Mexico and the cold air from Canada clash. The region is known as “Tornado Alley’’ which spans from Texas to South Dakota. States in this area are more prone to Tornadoes and other severe storm events.
2 Which states have the most Windstorms?
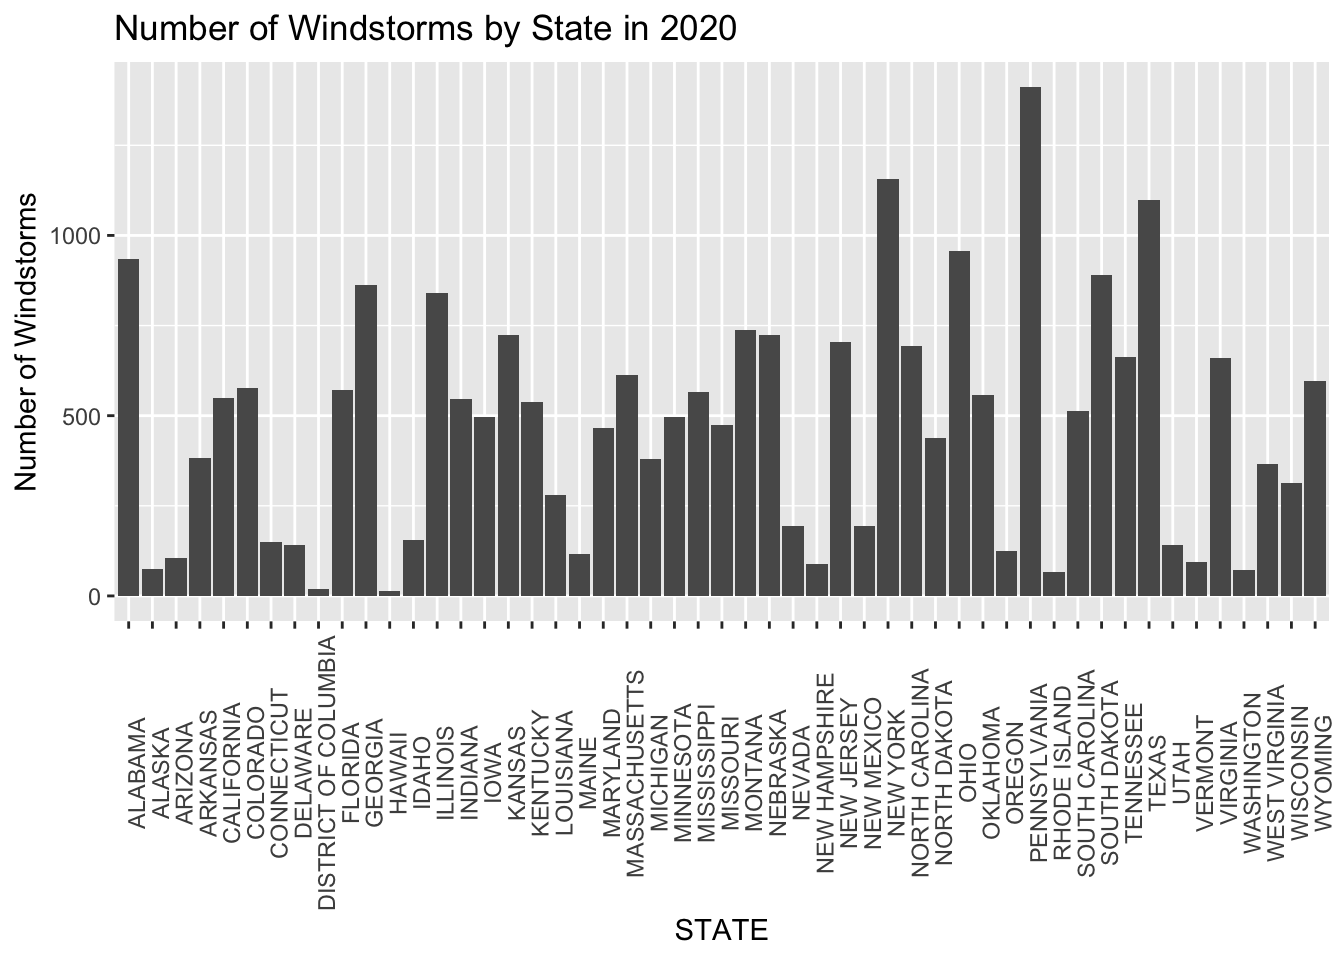 Since the dataset includes all 50 states, we wanted to explore which specific states to focus our analysis on. First, we began by identifying which states have the most severe storm events in the US during the year 2020. Through creating a histogram and arranging the data to display the top 5 states, we were able to identify that PENNSYLVANIA, New York, TEXAS, OHIO, and ALABAMAwere the top 5 states with the most storms.
3 Do More Storms Necessarily Mean an Increase in the Amount of Property Damaged by Windstorms?
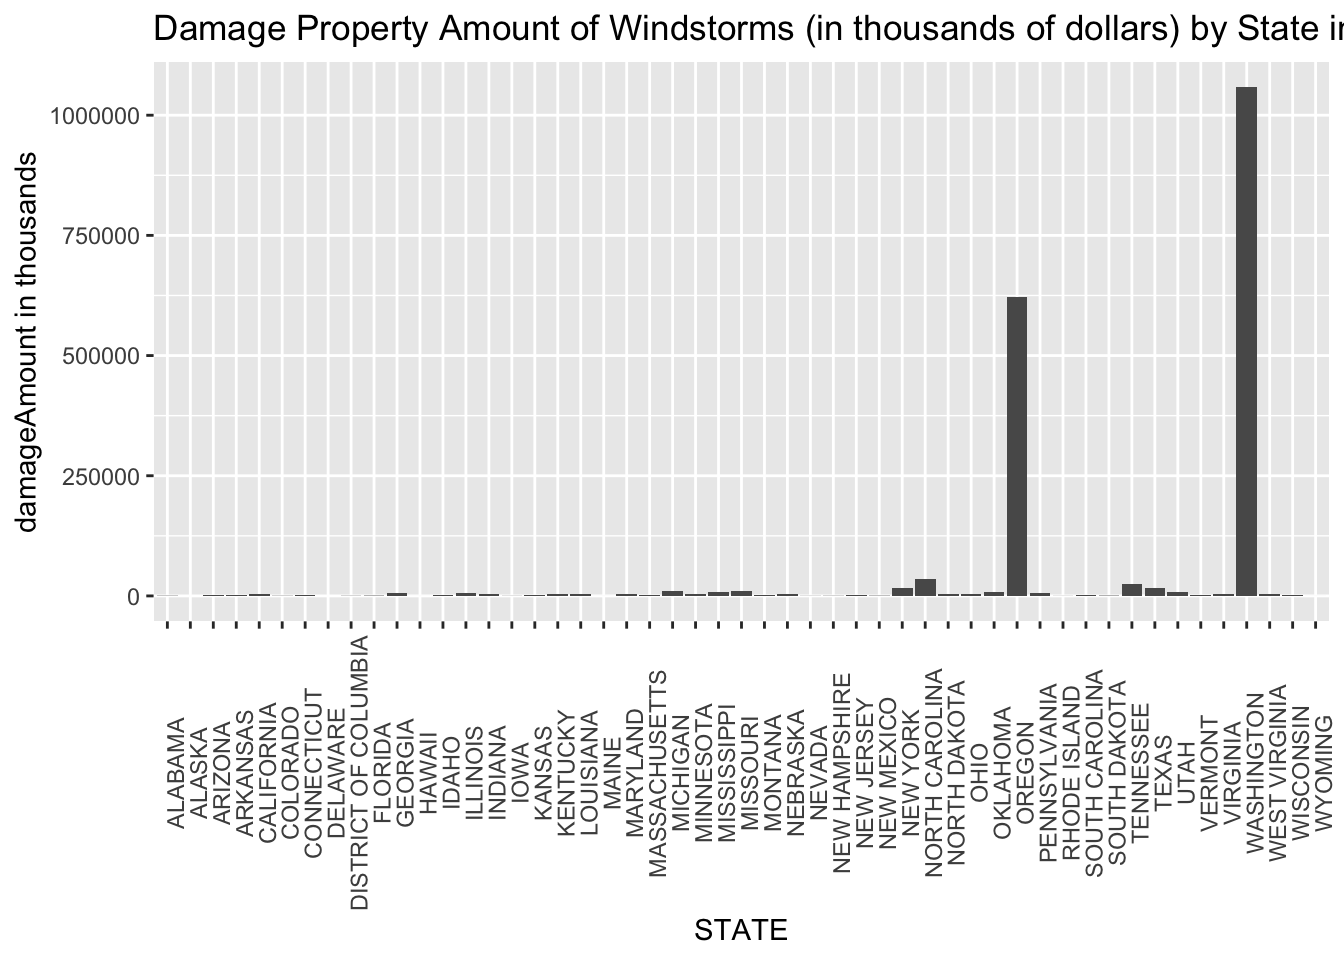
Based on the histogram above, OOregon and Washington have a significantly higher amount of damage property than other states. States with most damage property amounts are not as same as those with most numbers of storms in the U.S. It indicates that more storms might not necessarily mean more damage to properties. Is a negative relationship between frequency of storms and damage property value? Are are any other factors influence damage property value?
What Factors Influence Damaged Property by Storms?
To better understand the factors in damage property values, we are going to build statistical models. We proceeded by brainstorming potential factors that might have influence on the wide gap of damage amount. We hope to investigate on how GDP per capita, magnitude of wind storms, number of windstorms, average elevation, and average home value influence damage property amount of windstorms. As a result we can see magnitude, average home value, GDP per capita, average elevation have positive influence on the damage property amount. However, there is a negative relationship between frequency of windstorms and damage amount. It shows that the states with most occurrences of Windstorms do not mean they suffered the most financial loss. Our estimates on those factors can be used to estimate the damage property amount based on these factors for each state. While we only incorporated data from year 2020, the estimate provided would be a good start for further analysis.
Interactive Component
Here is our interactive histogram based on the pattern of GDP per capita, Magnitude of Windstorms, number of Windstorms, Average Elevation, Average Home Value and Damage Property Amount by State. We can see the differences of each variable across state by clicking on each of the factors.
Here is the access to interactive Component
Conclusion
Just last week, storms unleashes devastating tornadoes across 8 states in central and southern United States, claiming at least 100 lives and leaving behind uninhabitable house, and a daunting path toward recovery. Of all the states that were affected, Kentucky had it the worst as the state was hit by four tornadoes, which resulted in at least 70 deaths. One tornado followed a trail of 200 miles, which fatally destroyed many homes, a candle factory, and distribution centers.
In this project, we investigated the pattern of windstorm occurrences in terms of location, time of the year, severity in terms of damage amount caused and developed a model with various factors to estimate the damage amount. Our analysis shows that states in the Midwest/South have the most storms, thus this storm event was expected to hit this region. Our model also shows that states in the South/Midwest region undergo the most damage, thus we are to conclude that these tornadoes definitely caused significant infrastructure damage to Kentucky. What stood out was that according to our data, storm events are usually more prominent in the spring and summer season, therefore, it was rare for this devastating event to occur during December. If we were to move forward with this project, we believe incorporating climate change by conducting time-series analysis would allow us to draw better conclusions on the relationship between rising temperature and severe storm events. For this project, we focused in the most recent year with complete data. From our model regression result, we can see that the magnitude, average home value, GDP per capita, and average elevation of where the wind storm took place are all positively correlated with the damage amount incurred by the windstorm, and we can obtain an estimate of the amount by using the model we developed on the analysis page.
This recent event demonstrates the importance of analyzing storm event data and predicting trends as it can help minimize the toll the tornadoes took on the U.S. Inferring storm patterns could help prevent the loss of many lives and allow governments to create an evacuation plan ahead of time for states that would be affected.